Chapter 17: JVM Architecture, Memory Model, and Garbage Collection
By Ali Naqi | October 27, 2026
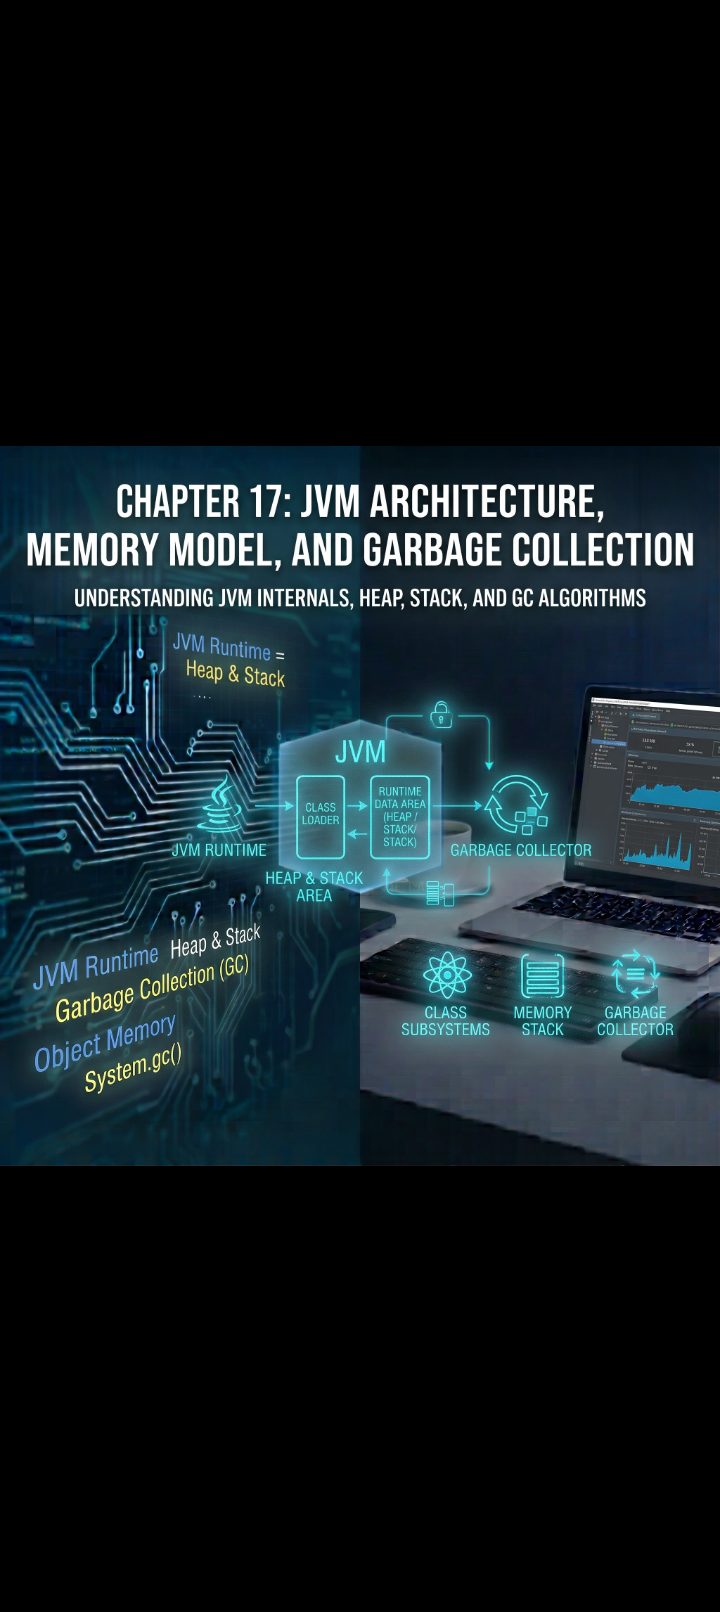
⚙️ Chapter 17: JVM Architecture, Memory Model, and Garbage Collection
1. The Tripartite Engine: High-Level Architecture
The JVM is not a monolithic binary; it is divided into three distinct operational subsystems:
┌─────────────────────────────────────────────────────────────┐
│                   1. ClassLoader Subsystem                  │
│       Loading  ───►  Linking (Verify, Prepare, Resolve)     │
│                     ───►  Initialization                   │
└──────────────────────────────┬──────────────────────────────┘
                               │
┌──────────────────────────────▼──────────────────────────────┐
│             2. Runtime Data Areas (JVM Memory)              │
│  [Method Area / Metaspace]   [Heap]                         │
│  [JVM Stack (Per Thread)]    [PC Registers]  [Native Stack] │
└──────────────────────────────┬──────────────────────────────┘
                               │
┌──────────────────────────────▼──────────────────────────────┐
│                    3. Execution Engine                      │
│     Interpreter  ───►  JIT Compiler (C1 / C2)  ───►  GC     │
└─────────────────────────────────────────────────────────────┘
- ClassLoader Subsystem: Finds and loads compiled binary
.classfiles into memory, validates their integrity, and initializes static variables. - Runtime Data Areas: The structured memory spaces allocated by the OS to host application data, call stacks, and execution metadata.
- Execution Engine: Reads bytecode instructions and turns them into native CPU instructions, dynamically optimizing "hot" code paths while cleaning abandoned objects via the Garbage Collector.
2. The ClassLoader Subsystem: How Classes Arrive in Memory
Classes are loaded dynamically on demand, not all at once at startup. The ClassLoader architecture follows three core principles: Delegation, Visibility, and Uniqueness.
The Hierarchy of ClassLoaders
Loading follows the Delegation-Parent Principle. When a class needs to be loaded, a ClassLoader delegates the search upwards to its parent before attempting to locate the file itself:
- Bootstrap ClassLoader: Written in native C/C++. Loads foundational base libraries from the core runtime (
java.lang.*,java.util.*insidejava.base). - Platform ClassLoader (formerly Extension): Loads platform-specific extensions and standard runtime modules.
- Application (System) ClassLoader: Loads user code found on the application classpath or module path (
-cp,--module-path).
           [ Bootstrap ClassLoader ]
                       ▲
                       │ (Delegates up first)
           [ Platform ClassLoader ]
                       ▲
                       │ (Delegates up first)
          [ Application ClassLoader ]
                       ▲
                       │ (Delegates up first)
         [ Custom / Plugin ClassLoader ]
The Three Loading Phases
- Loading: Acquires the raw byte array of a class name from disk/network and constructs a
Class<?>metadata instance in memory. - Linking:
- Verification: Validates that bytecode adheres to JVM specifications and does not violate memory integrity or type safety.
- Preparation: Allocates memory for
staticfields and assigns standard default values (e.g.,0,false,null). - Resolution: Replaces symbolic references in the constant pool with direct memory addresses.
- Initialization: Runs
static { ... }initializer blocks and assigns explicitly declared values to static variables.
3. Runtime Data Areas: The Memory Layout
When the JVM runs, its memory footprint splits into Thread-Shared and Thread-Isolated areas.
 Shared by All Threads (Global)        Isolated Per Thread (Private)
┌─────────────────────────────────┐   ┌─────────────────────────────┐
│             HEAP                │   │      JVM Call Stack         │
│  (Objects, Arrays, Instances)   │   │  [Stack Frame: Locals,      │
│                                 │   │   Operand Stack, Frame Data]│
├─────────────────────────────────┤   ├─────────────────────────────┤
│      METASPACE (Native Memory)  │   │     Program Counter (PC)    │
│  (Class Metadata, Bytecode,     │   ├─────────────────────────────┤
│   Method Table, Interned Pools) │   │     Native Method Stack     │
└─────────────────────────────────┘   └─────────────────────────────┘
A. The Thread-Private Spaces (Allocated per Thread)
-
JVM Stack: Contains stack frames pushed whenever a method is entered and popped when it returns. A frame holds:
-
Local Variable Array: Primitives and reference pointers scoped to the method.
-
Operand Stack: The workspace where intermediate calculations occur (e.g., pushing two integers and running
iadd). -
Frame Data: Pointers back to the constant pool and exception tables.
-
Program Counter (PC) Register: Tracks the physical memory address of the JVM bytecode instruction currently being executed by the thread.
-
Native Method Stack: Dedicated call stacks reserved for executing native C/C++ libraries via JNI (Java Native Interface) or the Foreign Function & Memory API.
B. The Shared Spaces (Visible to All Threads)
- The Heap: The primary storage area for all instantiated objects and arrays. This is the domain managed by the Garbage Collector.
- Metaspace (replaces PermGen since Java 8): Stores class metadata, runtime constant pools, and method definitions. Unlike legacy PermGen, Metaspace does not reside within the contiguous JVM heap; it allocates memory directly from the operating system's off-heap native virtual memory. It grows dynamically unless bounded via
-XX:MaxMetaspaceSize.
4. Execution Engine: Interpreters, JIT, and HotSpot
Bytecode is not native assembly. The CPU cannot run it directly. The Execution Engine bridges this gap:
                  Bytecode (.class)
                          │
                          ▼
                  [ Interpreter ]  ──► (Executes immediately, slow)
                          │
              Tracks invocation counters
                          │
                          ▼
            [ JIT Compiler (Tiered) ]
             ├── C1 (Client Compiler)  ──► Quick compilation, basic optimizations
             └── C2 (Server Compiler)  ──► Deep analysis, aggressively optimized native code
- Interpreter: Reads bytecode instructions one by one and translates them immediately into machine code. Fast startup, but slow execution.
- JIT (Just-In-Time) Compiler: The JVM monitors running code to identify "hot spots"—methods or loops executed repeatedly. The JIT compiles these sections straight into native machine code:
- C1 Compiler (Tier 1-3): Compiles quickly with basic optimizations to improve throughput early.
- C2 Compiler (Tier 4): Evaluates high-frequency code paths and applies aggressive optimizations:
- Method Inlining: Replaces a method call directly with the method's body, removing call-stack frame overhead.
- Dead Code Elimination: Strips away code paths verified to be unreachable at runtime.
- Loop Unrolling: Replicates loop bodies to reduce branching conditions.
- Escape Analysis: Determines if an object allocated inside a method never escapes outside that method. If it doesn't, the JVM can skip Heap allocation entirely and allocate the object's fields directly onto the Stack (scalar replacement), saving GC work.
5. Garbage Collection Fundamentals: Mark and Sweep
Manual memory management (like malloc and free in C) is error-prone, leading to dangling pointers, double-free bugs, and memory leaks. Java uses automatic Garbage Collection (GC).
GC Roots and Reachability
How does the collector determine if an object is dead? It does not use reference counting (which fails on circular references). Instead, it uses Tracing Reachability from designated GC Roots:
An object is alive if a direct reference path traces back to a root. Anything unreachable is garbage.
Standard GC Roots:
- Local variables in active thread stack frames.
- Active Java Threads.
- Static fields attached to loaded classes.
- JNI (native) references.
[ GC Root: Active Stack Frame ]
             │
             ▼
      [ User Object ]
             │
             ▼
      [ Address Object ]

[ Orphaned Node A ] ◄──► [ Orphaned Node B ]   <-- Circular, but no path to GC Root: COLLECTED!
The Core Phase Cycle
- Mark: Traverse the graph of object references starting from all GC Roots. Mark all reachable objects as "live."
- Sweep: Scan the heap space and reclaim memory addresses occupied by unmarked (dead) objects.
- Compact: Shift surviving live objects into a contiguous block at the front of the heap to prevent memory fragmentation.
6. Generational Garbage Collection
Empirical analysis across thousands of production workloads revealed the Weak Generational Hypothesis:
- Most created objects have very short lifespans (temporary variables, stream pipelines, DTOs).
- Objects that survive their first few collection cycles tend to remain alive for a long time.
To exploit this behavior, the Java Heap splits into generations:
┌─────────────────────────────────────────────────────────────┬───────────────────────────┐
│                       YOUNG GENERATION                      │      OLD GENERATION       │
│  ┌───────────────────────┬───────────────┬───────────────┐  │        (Tenured)          │
│  │     Eden Space        │ Survivor (S0) │ Survivor (S1) │  │                           │
│  │ (New allocations go   │   [ From ]    │    [ To ]     │  │ (Long-lived survivors     │
│  │  here)                │               │               │  │  promoted here)           │
│  └───────────────────────┴───────────────┴───────────────┘  │                           │
└─────────────────────────────────────────────────────────────┴───────────────────────────┘
-
Eden Space: All new objects (via
new) start here. -
Survivor Spaces (
S0/S1): When Eden fills up, a Minor GC triggers: -
Surviving objects move to the empty Survivor space (
To), incrementing an age counter. -
The roles of
FromandToswap. -
Old (Tenured) Generation: When an object survives enough collection cycles (governed by
-XX:MaxTenuringThreshold, default 15), it is promoted to the Old Generation. Major/Full GCs collect this space less frequently.
7. Modern Garbage Collectors in Production
Java provides several pluggable GC implementations tailored for different throughput and latency needs:
| Collector | Target Goal | Typical Pause Time | How It Operates | Best Used For |
|---|---|---|---|---|
Serial GC (-XX:+UseSerialGC) |
Low footprint | High (Stop-the-World) | Single-threaded Mark-Sweep-Compact. | Small CLI scripts, micro-containers (<512MB RAM). |
Parallel GC (-XX:+UseParallelGC) |
Maximum throughput | Moderate to High | Multi-threaded young/old collection; pauses application during GC. | Offline batch jobs, background data analytics. |
G1 GC (-XX:+UseG1GC) |
Balanced predictability | Controlled (<200ms) | Divides heap into independent regions; prioritizes regions with the most garbage first. | General-purpose enterprise web services (Default since Java 9). |
ZGC (-XX:+UseZGC) |
Ultra-low latency | Sub-millisecond (<1ms) | Concurrent coloring pointers and load barriers; scales to multi-terabyte heaps. | Financial trading, high-SLA microservices, massive in-memory caches. |
How G1 (Garbage-First) Breaks the Heap
Instead of rigid contiguous generational boundaries, G1 splits the entire heap into thousands of equal-sized Regions (1 MB to 32 MB each). Each region is assigned an Eden, Survivor, or Old role dynamically. G1 tracks which regions contain the highest ratio of dead objects and collects those first (hence: Garbage-First), meeting a target pause time set via -XX:MaxGCPauseMillis.
8. Practical Diagnostics: Memory Leaks and Analysis
Java manages memory automatically, but you can still introduce logical memory leaks—retaining references to objects you will never use again, preventing GC reclamation.
Common Memory Leak Antipatterns
- Unbounded Caches: Static collections growing indefinitely without eviction policies.
- Unregistered Listeners / Callbacks: Registering event listeners on long-lived components without calling unregister when discarding callers.
- ThreadLocal Retention: Failing to invoke
.remove()onThreadLocalvariables inside thread pools where threads never terminate.
Diagnosing with Built-in JDK Tools
Every JDK comes equipped with operational CLI diagnostic utilities:
# 1. Identify the process ID (PID) of your running JVM
jps -v

# 2. Inspect real-time memory distribution and GC pause frequencies
jstat -gcutil <PID> 1000

# 3. Print a quick histogram of objects consuming the most heap memory
jhsdb jmap --histo --pid <PID>

# 4. Capture a full memory dump for offline analysis in Eclipse Memory Analyzer (MAT)
jcmd <PID> GC.heap_dump /tmp/heap_analysis.hprof
📝 Chapter Summary
- The JVM operates via three subsystems: the ClassLoader, Runtime Data Areas, and the Execution Engine.
- Loading follows delegation: the Application ClassLoader delegates upwards to the Platform and Bootstrap loaders before resolving classes locally.
- Stack Memory is thread-private, hosting primitive local variables and reference pointers within execution frames; Heap Memory is shared globally and holds all instantiated objects.
- Metaspace replaced PermGen in Java 8, allocating class metadata out of native, off-heap OS memory.
- The JIT Compiler uses tiered compilation (C1 for speed, C2 for heavy profiling) to convert frequently invoked bytecode into optimized native machine code.
- Garbage Collection traces reachability from GC Roots; the Generational Model (Eden, Survivor, Tenured) exploits the reality that most objects die young.
- Choose the right collector: G1 GC provides balanced, pause-predictable performance for standard enterprise applications, while ZGC delivers sub-millisecond pauses for latency-critical systems.